Dashboard
Alerts Dashboard in Configuration Menu
Audience:
AdministratorsSkill Prerequisites:
Understanding of System Health
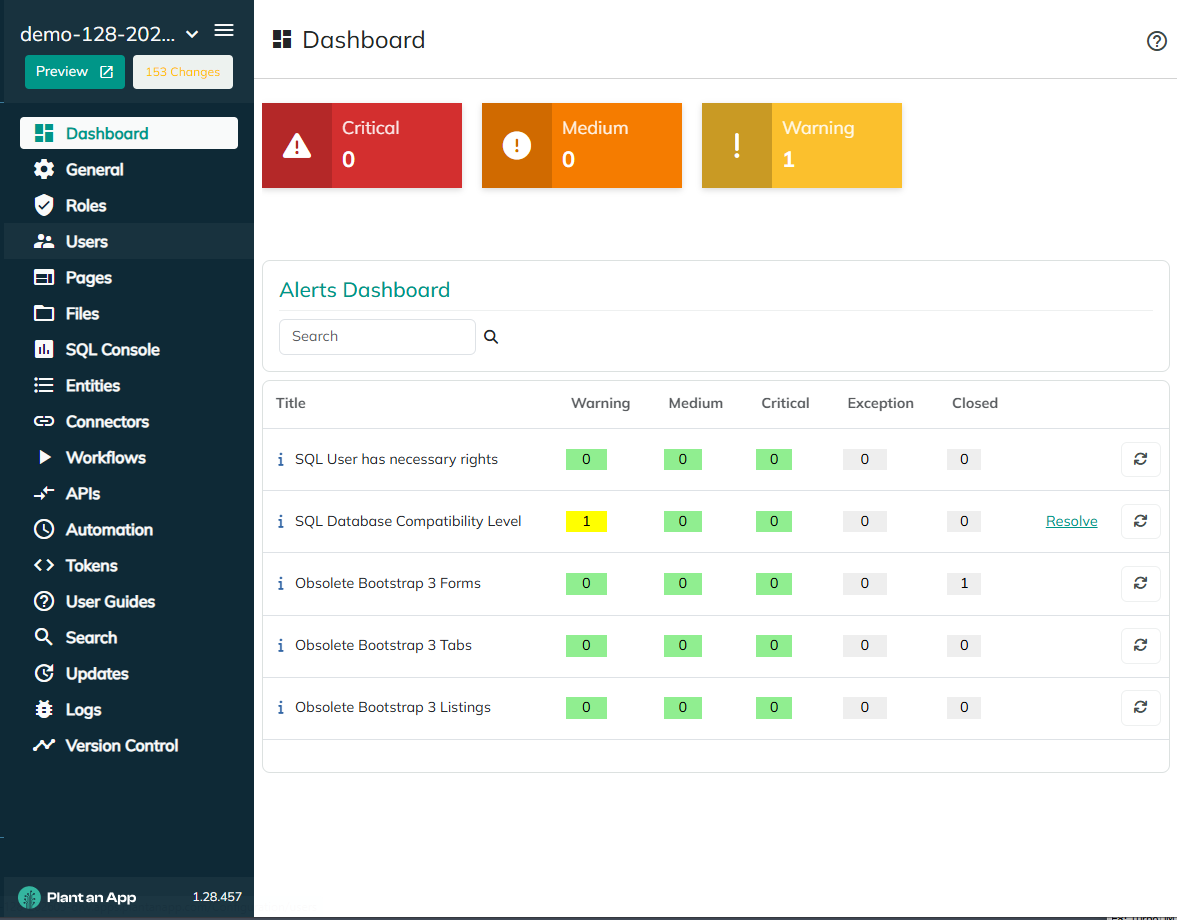
With the release of Plant an App version 1.28.457 and above, the Configuration page now features a Dashboard. This dashboard replaces the previous "Getting Started" page and provides a comprehensive view of system health alerts.
Overview of Alerts Dashboard
The Alerts Dashboard is designed to provide critical health check information for your system by displaying various alerts. These alerts are categorized based on severity:
- Critical
- Medium
- Warning
Initially, there are five types of alerts focusing on system health checks.
Dashboard Features
Key Tiles: Displaying the count of current critical, medium, and warning alerts for quick reference.
Alerts List: Displays detailed information on each alert type, including the number of warnings, mediums, and critical alerts. The table format includes:
- Title of the alert
- Counts for warnings, mediums, and criticals
- Exception and Closed status
Alert Colors:
- Green: Indicates no open alerts in that category.
- Yellow: Represents a warning alert.
- Orange: Indicates a medium-level alert.
- Red: Used for critical alerts.
Managing Alerts
- Information Icons: Positioned next to alert titles, providing more details about each alert type.
- Resolve Alerts: Click on the resolve option to start addressing an alert using provided guidance.
- Refresh Button: Allows manual refresh of a specific alert to see if it has been resolved or updated.
- Alert Details: Clicking on alert counts provides further details, including severity, status, creation, and closure dates.
Handling Exceptions
You have the option to mark specific alerts as exceptions, providing a reason for the exception. These exceptions will not be counted in future alert evaluations.
Resolving Alerts
When resolving alerts, detailed instructions are provided. Users may also find hyperlinks in the instructions linking to related documentation for more comprehensive guidance.
Alert Schedule
The dashboard’s alerts are set to update automatically on a schedule, usually once per day, giving you the latest snapshot each time you visit the page. However, individual alerts can be refreshed manually using the refresh button.
Current Alerts (as of version 1.28)
- SQL User Rights: Ensure SQL users have the necessary permissions prior to upgrades.
- SQL Database Compatibility Level: Alerts if compatibility levels are not aligned with the SQL version.
- Bootstrap 3 Components: Alerts for any remaining Bootstrap 3 forms, tabs, or listings, as support will be removed in version 1.29.
This enhanced dashboard ensures that administrators are always aware of potential issues within their system, allowing for timely interventions and ensuring optimal system health.
Revised 05/12/2026